Sometimes my projects take little excursions.
I was working on a project related to my personal finances, where I exported a large amount of data from an ancient version of Quicken and wrote Python code to read that data and perform various analyses on it. In amongst that data were the dollar amounts for every check I had written since approximately 1994.
I decided to analyze this list of transaction amounts against Benford’s Law, which describes an interesting relationship that is often found in long lists of ‘real-life’ numbers. It concerns the frequency with which each digit between 1 and 9 appears as the first digit of the numbers. In real-life data, Benford’s Law states that the frequency with which digit \(d\) between 1 and 9 appears as the first digit is roughly:
\(P(d) = log_{10}(\frac{d + 1}{d})\)
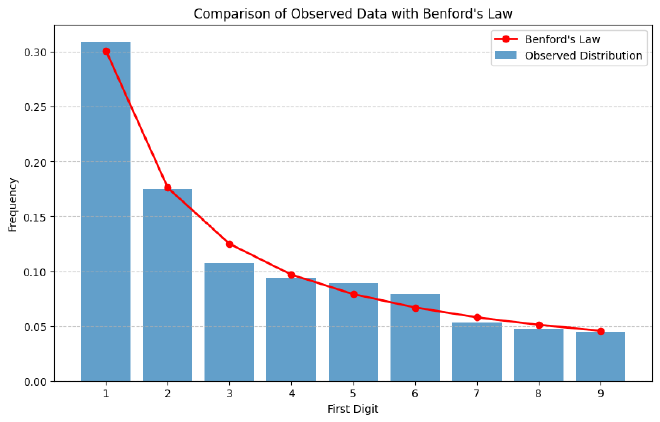
It is good to know that my financial transaction amounts follow Benford’s Law quite well:

The blue bars show the frequency with which each digit occurred first in my transactions data, and the red line is the prediction from Benford’s Law.
If the distribution produced by a set of numbers differs significantly from that predicted by Benford’s Law, it may be an indication that the numbers have been tampered with or fabricated by humans. The idea is that humans making up numbers tend to distribute the digits more uniformly than would be predicted by Benford’s Law. This has been used to detect fraud, and violations of Benford’s Law have been admitted as evidence in criminal cases.
A large caveat to applying Benford’s Law for fraud detection is that it only works when used on large lists of numbers, and the numbers have to span several orders of magnitude.
