A common concern in pre- or early retirement is, “Will I run out of money during retirement?” Or the related, “How much can I spend during retirement before I run out of money?” As with many other retirement financial planning questions, many websites and professionals are ready to help you answer these questions. But as with the first Coding for (Social) Security post in this series, I wanted to take a more hands-on, coding-centric, DIY, learn-as-I-go approach.
A common way to answer the “Will I run out?” questions is to simulate many scenarios of spending, income, and (most importantly) investment returns during your retirement years. While you can get a reasonable deterministic handle on your income and probably your expenses, the best you can do to estimate the effect of market returns on your retirement is to make some assumptions about how the market will perform, and ‘roll the dice’ multiple times to generate plausible market scenarios given those assumptions. This is the Monte Carlo approach. If the Monte Carlo simulation shows that your retirement savings will last through your retirement years, even for bad market conditions, you can rest a little easier at night. Or spend more money.
I have an interest in Monte Carlo simulation techniques generally because they are commonly used in technical and scientific pursuits. So I managed to keep myself interested in financial matters this time by applying Monte Carlo techniques to retirement financial planning.
The Setup
You have some amount of retirement savings, let’s say one meel-yun dollars, and you have this money invested so that it is earning some amount of return for you. During retirement you have some income from Social Security, a pension, or perhaps a part-time job. You have various expenses in retirement; some are practically unavoidable (e.g. taxes, utilities, insurance), while others you can control (e.g. only take one vacation each year instead of four). If during any month of retirement your expenses exceed your income for that month, you will need to withdraw money from your retirement savings to cover the difference. So if you subtract your month-by-month expenses from your month-by-month income, you get the month-by-month amount of money that you will have to withdraw from your retirement savings.
Meanwhile, your invested retirement savings are earning a return that can fluctuate significantly from year to year, and can be negative in bad years. Let’s think of this investment return in terms of the percentage increase or decrease of your current retirement savings balance - e.g. your balance might go up by 10% in good years or down by 20% in really bad years. We will try to predict investment returns by making some assumptions based on past market behavior and generating randomized simulated market returns for each year, and apply that return (positive or negative) to your retirement savings balance year by year. Thus you get several simulated scenarios of how your retirement will play out, in terms of the year-by-year balance in your retirement savings. If your required withdrawals and/or bad market conditions shrink your retirement savings balance to 0, you are broke. Let’s call that scenario a ‘failure’, and any scenario where you still have retirement savings left when you get to some ripe old age a ‘success’. You can simulate many market return scenarios and see what fraction of those scenarios result in retirement ‘success’ vs ‘failure’. A 100% probability of success means that you did not run out of savings in any scenario, even those with the worst simulated market returns. Any probability less than 100% means that there were some scenarios where you ran out of money. Perhaps you can reduce your expenses to get your probability of success closer to 100%.
The Retirement Simulator App
The Retirement Simulator web app can help you understand your retirement finances by simulating market returns into the future, over some age range that you specify, given the income and expenses that you enter and your estimated market performance parameters.
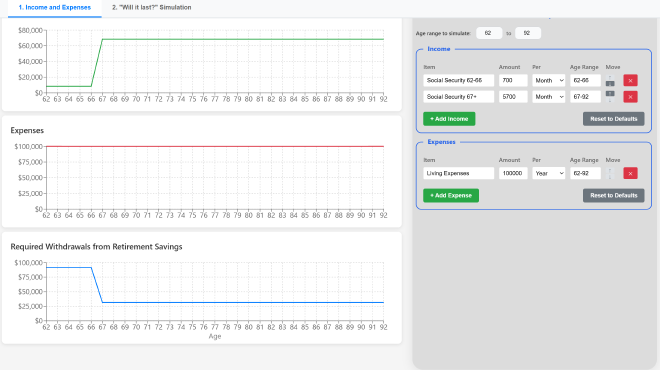
The Retirement Simulator App showing the Income and Expenses tab
The web app has two tabs. The first Income and Expenses tab is essentially a worksheet that helps you calculate how much money you will need to withdraw from your retirement savings each year (bottom chart), taking into account your expected income (top chart) and expenses (middle chart).
Your income and expenses are specified by making entries into the tables on the right. Each entry has an item name, a dollar amount, a specification for how often that income or expense occurs (either monthly, each quarter, or yearly), and an age range over which the item is active. The default entries in the Income table, which may have come from the Social Security split strategy explored in the Coding for (Social) Security web app, illustrate how your income from Social Security could change over time. So if you are planning to use the split strategy and have the Higher Earner claim Social Security benefits at age 67, the first table entry is the Lower Earner’s benefits from age 62 to 66, and the second entry is the combined benefits after the Higher Earner claims. If you instead elect to have both you and your spouse claim Social Security benefits at age 62, just a single entry for the combined monthly Social Security benefit will do. Or you can add an entry each for you and your spouse’s benefits separately - it is up to you.
The expenses table works the same way. You can be as detailed or as general as you like with this table - if you think your total expenses will be $100k per year always, you can just have a single entry in the table that covers all your expenses. Or you can break it down to have detailed entries for insurance, taxes, utilities, possibly house and car payments, etc. You might add an entry for Vacations, so that you can explore how often you can afford to take vacations. Or maybe you plan to buy a new car in a few years or do some renovations on your home; you can add those as expenses, either as a single lump sum expense or as monthly car or home improvement loan payments spread out over some range of ages.
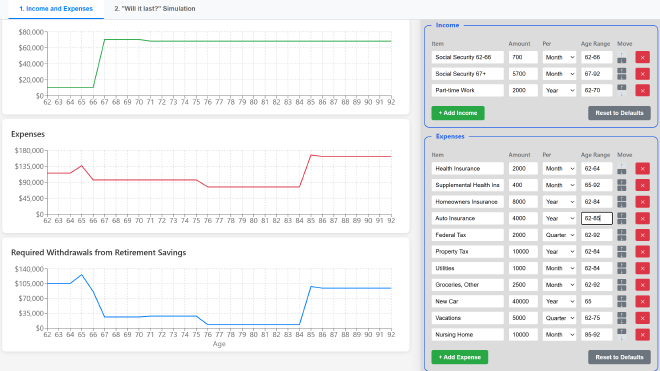
The Retirement Simulator App showing more detailed expenses
You can add, delete, and rearrange the entries to taste. Note that the app will remember your inputs (including the income and expenses) using a feature in your browser called local storage, where your entries are remembered only on your system by the web browser - the data is not stored in some database on the server side. I am a private enough person that I dislike entering numbers about my financial situation on other retirement planning websites because I don’t trust the site not to store that information, correlate it back to me somehow, and use that data for purposes that I wouldn’t approve of. Rest assured that this won’t happen if you decide to try out this web app. There is no server-side component to this web app and thus no database to store any values - it runs entirely in your browser, and any numbers you enter never leave your machine.
The entire purpose of the first tab is to get the amount of money that you will need to withdraw from your retirement savings as a function of time, as depicted on the bottom chart. This is completely determined by your entries in the table - there is no Monte Carlo simulation being done here yet. That happens on the second tab.
On the “Will it last?” Simulation tab, you can enter the amount of retirement savings that you have at the starting age for the simulation.
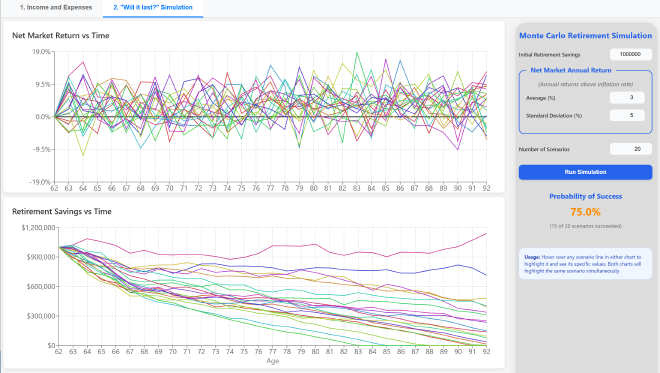
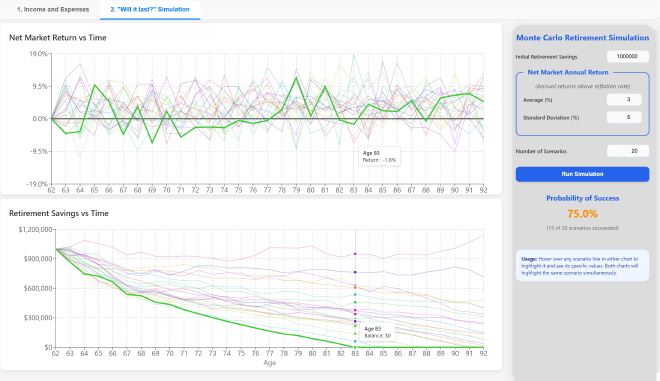
The Retirement Simulator App Simulation tab
Under Net Market Annual Return you should enter estimates for how you think your invested retirement savings will perform over the years. Two numbers are required:
-
Average : Enter how much you think your balance will increase each year, on average, expressed as a percentage increase or decrease in your retirement balance. As discussed below, you must enter a value here that is “net inflation.” That is, your estimate for the average return on your retirement balance needs to take inflation into account by subtracting it from the actual market investment returns. If your investments return 5% for a year but the inflation rate is 3%, your net return is 2%.
-
Standard Deviation : This is an estimate of the volatility of the market over the simulated years. If you expect the market (and/or the inflation rate) to have wild swings year to year, enter a larger number here. If you expect relatively smooth sailing, with only slow steady changes each year, enter a smaller number.
If you are invested in safe, conservative investment vehicles like bonds or annuities, you might enter a lower average and a lower standard deviation, but if you are invested in riskier stocks, perhaps a higher average return with a higher standard deviation (more volatility) is more appropriate. After entering values, inspect the net market returns in the top chart to see if it paints a realistic picture of the market conditions you expect. An important usability feature of this app is that hovering the mouse over a scenario line will highlight that line and fade all the other lines, so it is much easier to inspect individual scenarios selected from the jumble.
The results of the simulations are shown in the bottom chart, which shows the retirement savings balance for each year. Again, the mouse-over highlighting is crucial for making sense of the results. If a scenario ever reaches $0, that run counts as a failure. The app will calculate and display the percentage of scenarios that ‘failed’ and give you a probability that you have a ‘successful’ retirement (as in, you didn’t run out of money before the specified ending age). You can press the Simulate button to ‘roll the dice’ again and generate a number of new scenarios with different random numbers. Changing any input parameter will also re-run the simulation.
Sequence of Returns Risk
It is instructive to mouse over the best and worst case scenario lines on the bottom chart and then look at the corresponding simulated return lines on the top chart for those scenarios. The best case lines have many years with high returns, and any years with big losses most likely came later in retirement. The worst case lines generally have several bad return years, and those bad years most likely came earlier in retirement.
This illustrates that even one or two bad years near the start of retirement can have a huge impact on your retirement savings. The reason is that a bad year early in retirement reduces the balance for the entire duration of the simulation, and any good years after that have a reduced balance to work with, so they have to be really good years to get you back to the starting balance. A loss of 20% requires a gain of 25% to get back to the starting balance. And, if you are making significant withdrawals during a bad year to cover your expenses, you are forced to sell investments at a loss, which makes it even harder to recover. This is what is referred to in the financial planning industry as Sequence of Returns Risk - the risk that a few bad years early in retirement will significantly reduce your chances of a ‘successful’ retirement.
A scenario with great market returns! A scenario with bad luck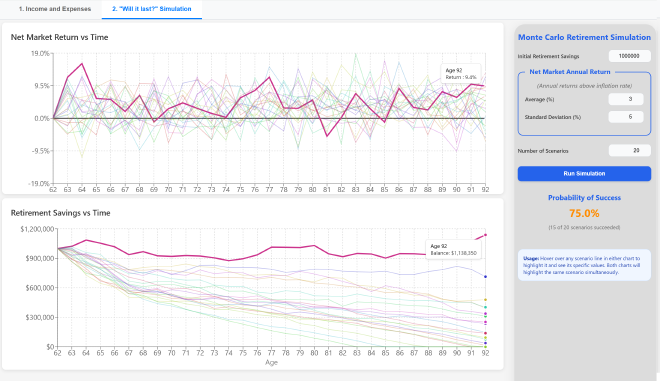
There is another effect at work here that arises because you have a fixed starting balance, and once that balance reaches $0, it stays at $0. There is a similar effect called risk of ruin for casino blackjack players who have only a small, fixed amount of money to gamble. A string of losing hands early on can reduce your chips to $0, and then you are done. The casino has all your money and you get no opportunity to continue playing to experience the winning hands that might have come later. Whereas another player with the same fixed amount to gamble might get a string of winning hands early on, bumping up their chip balance. So even if the same string of losing hands that bankrupted the first player happened to the second player later, the second player still has chips left and so has stayed in the game longer.
Inflation
You might notice that this app does not ask you for an estimate for the inflation rate, like some other retirement planners do. This web app implicitly accounts for inflation by embracing the following assumptions:
-
Your income will increase each year to keep pace with inflation. If your income will be from Social Security, this is perhaps not a terrible assumption because in principle your benefits should get cost-of-living adjustments each year to account for inflation. And some pensions do this too.
-
Your expenses will likewise inflate at the same rate.
-
Your investment returns have been specified as net inflation.
These assumptions taken together mean that the entire simulation runs in today’s dollars. Or perhaps more accurately, every dollar amount shown in the simulator is in terms of the dollar’s buying power at the start of the age range to simulate - e.g. in ‘Age 62 dollars’. Handling inflation in this way makes the results easier to interpret IMHO - if you started with $1M and the simulated scenario shows that you still have $1M 25 years later, that means that you can expect to have the same buying power in 25 years that you have today.
Retirement Simulator Details and Limitations
This web app makes some simplifying assumptions and chooses not to handle certain considerations:
-
The timestep for the calculation is each month, but the charts only plot one value per year. The net market return is simulated for the entire year. That is, each month the savings withdrawal amount for that month is calculated from the income and expenses and is subtracted from the savings balance. Then the investment performance per year divided by 12 (months) is applied to the balance. This per-month calculation is repeated 12 times then the final balance is plotted. If you mouse over the simulation lines, the balance shown in the tooltip is that for the beginning of the year, while the return shown is for the previous year.
-
Taxes on withdrawals are not addressed. The app could probably be made sophisticated enough to cover this (using the tax laws currently in effect), but it would add significant complexity. Especially since if your retirement savings is in a pre-tax account (e.g. 401k), how much you withdraw affects how much tax you have to pay which changes how much you have to withdraw, which in turn changes how much tax you have to pay, which… So instead it is on you to estimate your yearly or quarterly tax burden as a line item expense.
-
After age 75, you are required to take Required Minimum Distributions (RMDs) from pre-tax retirement accounts. This is extra taxable income that you may or may not need, but are forced to take anyway. This can significantly affect your tax burden. Some folks who have a lot of money in pre-tax accounts elect to move that money into Roth IRA accounts early in retirement to avoid this RMD tax problem later on in retirement. But this increases the taxes that you have to pay before you turn 75 - doing a Roth conversion essentially pre-pays taxes earlier to avoid paying higher taxes later. Personally, I don’t think RMDs will have a significant impact for the vast majority of retirees.
-
The app does not care whether your retirement savings are invested in stocks, bonds, CDs, annuities, savings accounts, or bitcoin. This is all swept under the rug by asking you to enter the average net investment return and its standard deviation. And as mentioned above, the app does not even care whether your retirement savings are pre-tax or after-tax - it is up to you to work out what your tax burden will be and enter it as an expense.
-
You don’t get to adjust the average return or standard deviation parameters as you age. E.g. you can’t simulate a situation where you have risky, high-return investments until you turn 75 then move everything into safe investments. Similarly, the app assumes that you stick stubbornly to the numbers you entered for income and expenses all the way to the end. In real life, if you saw that your finances were heading rapidly to zero, you’d likely make adjustments, like reducing your spending and maybe selling some assets or downsizing your living arrangements.
-
It is assumed that you have housing throughout your retirement. If you are paying a mortgage or rent each month, you should include that in your expenses. This simulation does not consider the equity you may have in your home, which can also fluctuate year to year and could in principle also be simulated.
Web App Implementation
This app was almost entirely vibe-coded using Warp. Like the other recent web app projects that I have toyed with, it is written in TypeScript using React and a chart package called Recharts. I intentionally asked the AI to produce an app with the same look and feel as the Social Security Split Strategy web app discussed in the previous post in this series. My impression is that vibe coding is getting easier and easier, and I think that is because the AI is improving, not because I am somehow getting better at prompting and babysitting it. It seemed to me that the AI took fewer wrong turns and made fewer changes that undid its previous fixes, relative to what I experienced with earlier vibe coding projects.
The vast majority of the code in the web app deals with the UI and simple accounting of values through time. But a couple of lines of code at the heart of the simulation are mathematically interesting to me. These lines implement the Box-Muller transform, which is an old and clever method to produce (pairs of) values that follow a Normal distribution. This is used within the simulation to generate the year-by-year market returns that conform to the average and standard deviation values entered by the user. The Box-Muller transform takes a pair of uniformly-distributed values generated by standard random number generators like Math.random(), and transforms them using log() and sin()/cos() functions such that the transformed values will be distributed according to a Normal distribution instead of the uniform distribution.
As an even geekier side-note, the Box-Muller method was considered to be inefficient because of its use of logarithmic and trigonometric functions, and therefore in performance-sensitive situations other algorithms to generate normally distributed numbers were used instead. (Performance is not really a concern with this app.) But recent hardware developments have shifted the performance edge back to the old Box-Muller transform in some cases. Read all about it here. It is interesting to me that two or three lines of code can have so much depth behind them.
Summary
The most difficult part of this project was knowing when to stop. The app originally had only the Monte Carlo simulation itself, and it just asked the user to enter a constant withdrawal amount per year. But then I thought it would be nicer to have more detailed, month-by-month calculations of the withdrawal rate with itemized income and expense items, to better handle situations where the withdrawal rate will change significantly with time, like when using the Social Security split strategy, or having to pay for health insurance until becoming eligible for Medicare at age 65. So the first tab was added to the app to model withdrawals as a function of age. This probably quadrupled the amount of code and complexity in the app, but I think it made it more realistic and useful.
I had considered adding more sophisticated handling of taxes, or perhaps simulating randomly-occurring surprise expenses along the lines of “You have a 5% chance every year of having to replace your roof, which will cost $10k”. But I decided that would just over-complicate the app.
While I don’t vouch for the accuracy of these simulations, playing with this app and trying out various spending and investment return assumptions did actually make me feel like I had a better understanding of how my retirement might play out financially, and so did alleviate some amount of worry that I had. So I can recommend the app for this purpose.